7 Best Root Cause Analysis Tools for 2026 (Methods & Apps)
Compare the best root cause analysis tools to stop failures. Learn how to use FMEA, Pareto charts, and RCA software to improve your system reliability.
When a BioGas processing system underperforms or a piece of equipment fails unexpectedly, guessing at the cause isn't an option. At 99pt5, we guarantee 99.5% BioMethane recovery and 99.5% CO2e emission reduction, numbers that demand precision engineering and systematic problem-solving. That same discipline applies when things go wrong: you need the best root cause analysis tools to identify what's actually happening, not just treat symptoms.
Whether you're troubleshooting a desulphurisation issue, tracking down efficiency losses in a processing train, or managing quality control across multiple project sites, the right RCA methodology makes the difference between a quick fix and recurring headaches. Some problems call for simple frameworks like the 5 Whys; others require dedicated software that logs data, tracks patterns, and generates reports for your entire team.
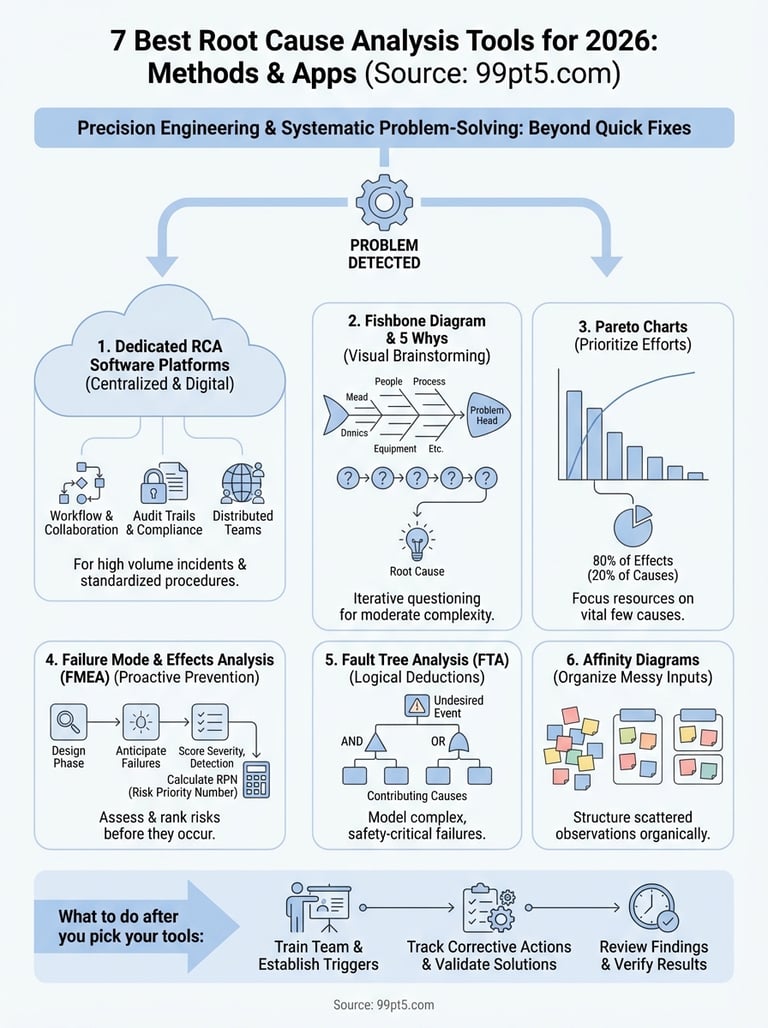
This guide covers seven proven root cause analysis tools, both traditional methods and modern applications, that engineers, project managers, and quality specialists actually use to solve problems in 2026.
1. Dedicated RCA software platforms
Software platforms designed for root cause analysis centralize your problem-solving workflow in one digital environment. Instead of juggling spreadsheets, whiteboard photos, and email threads, you enter incident details, assign investigators, attach evidence, and track corrective actions in a single system that logs every decision.
What it is
These applications provide structured templates for capturing problems, conducting investigations, and documenting findings. You typically create an investigation record that walks your team through data collection, analysis methods, and action planning. The software stores historical RCA reports, making it easier to spot recurring patterns across multiple incidents or project sites.
When to use it
Choose a dedicated platform when you manage high volumes of incidents, need audit trails for compliance, or coordinate RCA efforts across distributed teams. If your BioGas operation runs multiple processing trains or you install systems at different client sites, software keeps everyone working from the same methodology and data.
Software platforms become essential when your organization needs to demonstrate compliance, track metrics over time, or ensure investigations follow standardized procedures.
How teams run an RCA in software
You start by logging an incident with basic details: what happened, when, where, and initial observations. The platform then guides you through investigation steps, often including built-in templates for fishbone diagrams, 5 Whys, or timeline analysis. Team members can collaborate remotely, attaching photos, sensor logs, or maintenance records directly to the investigation. Most platforms include assignment features, so you can delegate action items and track completion.
How to validate causes and actions
Software tools typically require documented evidence before you can close an investigation. You link causes to specific data points, photos, or test results stored in the system. Validation might include peer review workflows, where a senior engineer or quality manager approves findings before implementation. The platform tracks whether corrective actions actually reduced incident frequency over time.
Cost, effort, and pitfalls
Expect annual subscription costs ranging from a few hundred dollars for small teams to several thousand for enterprise deployments with advanced analytics. Implementation takes two to four weeks for training and workflow setup. The biggest pitfall is treating the software as a filing cabinet rather than an active problem-solving tool. Teams that simply archive reports without reviewing patterns or following up on actions waste their investment in these best root cause analysis tools.
2. Fishbone diagram and 5 Whys
The fishbone diagram (also called Ishikawa or cause-and-effect diagram) and the 5 Whys technique are classic frameworks that work together to dig into problems without expensive software. You sketch a fish skeleton on a whiteboard where the head represents the problem and the bones branch into categories like equipment, people, process, materials, environment, and management. Then you drill down by asking "why" five times until you reach the actual root cause.
What it is
This combination pairs visual mapping with iterative questioning. The fishbone structure organizes potential causes into logical categories, preventing you from overlooking entire areas. The 5 Whys method forces you to move beyond surface symptoms by repeatedly challenging each answer until you hit bedrock. Together, they create a systematic yet flexible approach that adapts to complex technical failures or simple procedural breakdowns.
When to use it
Apply this method when your team needs to brainstorm collaboratively and the problem doesn't involve massive data sets. It works especially well for BioGas processing issues where multiple factors (feedstock quality, equipment settings, operator actions, environmental conditions) might interact to create failures. Choose this approach for moderate-complexity incidents where you need consensus quickly.
How to facilitate it step by step
Start by writing your problem statement at the fish head, then draw six bones representing your category framework. Gather your team and brainstorm potential causes under each category, using sticky notes or whiteboard markers. Select the most likely causes and apply the 5 Whys to each, asking "why did this happen" until you reach a fundamental cause that's actionable. Document every answer because later "whys" often reveal patterns you missed initially.
The 5 Whys technique loses effectiveness if you stop at organizational excuses like "human error" instead of digging into why that error occurred.
How to validate causes and actions
Test your conclusions by checking whether fixing the identified root cause would prevent the problem from recurring. Walk through the causal chain backward: if you implement your proposed solution, does each "why" in the sequence become irrelevant? You can also run a small pilot or gather historical data to confirm similar failures disappeared when teams addressed your suspected cause.
Cost, effort, and pitfalls
These remain among the best root cause analysis tools because they cost nothing beyond meeting time and whiteboard space. Facilitation requires 30 minutes to two hours depending on problem complexity. The main pitfall is stopping too early in your questioning or letting one loud voice dominate brainstorming, which produces incomplete analysis that misses actual root causes.
3. Pareto charts
A Pareto chart combines a bar graph with a cumulative line to show you which problems account for most of your failures. Named after the economist who observed that 80% of effects come from 20% of causes, this tool helps you prioritize where to focus your investigation efforts. In BioGas operations, you might discover that three equipment types generate 75% of your downtime incidents, or that two feedstock contamination sources cause 80% of your processing delays.
What it is
The chart displays problem categories in descending order by frequency or impact, with bars showing individual counts and a line graph tracking cumulative percentage. You read it left to right to see which few factors dominate your total problem load. The visual format makes it immediately clear where your improvement efforts yield maximum return, cutting through the noise of minor issues that distract teams from real priorities.
When to use it
Choose Pareto analysis when you track multiple problem types and need to decide which investigations deserve resources first. This works best after you've collected incident data over weeks or months, giving you enough volume to spot patterns. If your maintenance logs show 15 different failure modes but limited engineering time, a Pareto chart tells you which three modes to investigate deeply.
How to build it from real data
Start by categorizing your incidents (pump failures, valve leaks, sensor drift, contamination events) and count occurrences or measure impact like downtime hours. Sort categories from highest to lowest frequency, then calculate the cumulative percentage each represents. Plot bars for individual counts and overlay a line showing cumulative totals. Most spreadsheet tools include built-in Pareto chart templates that automate the math once you enter your data.
When you identify the vital few causes that drive most failures, you stop wasting investigation resources on problems that barely affect your operation.
How to validate causes and actions
Validate by verifying your data collection was complete and categories don't overlap. Check whether fixing the top Pareto items actually reduces your total problem count in subsequent periods. Run a new Pareto chart after implementing corrective actions to confirm the distribution shifted and different issues now dominate, proving you solved the right problems.
Cost, effort, and pitfalls
Building a Pareto chart takes 15 to 30 minutes once you have clean data, with zero cost if you use existing spreadsheet software. The main pitfall is poor categorization that lumps unrelated problems together or splits similar ones into artificial subcategories, distorting which issues truly matter and undermining the value of these best root cause analysis tools.
4. Failure mode and effects analysis
Failure mode and effects analysis (FMEA) is a proactive methodology that evaluates how components or processes might fail before they actually do. Unlike reactive tools that investigate problems after they occur, FMEA helps you anticipate failures and rank them by severity, occurrence likelihood, and detectability. This makes it one of the best root cause analysis tools for preventing problems rather than just fixing them.
What it is
FMEA uses a structured worksheet where you list every potential failure mode for a component or process step, then score each on three dimensions: severity (impact if it happens), occurrence (how likely), and detection (your ability to catch it early). Multiplying these scores produces a risk priority number that tells you which failure modes deserve immediate attention. You document potential causes and current controls, then design improvements to reduce the highest-risk scenarios.
When to use it
Apply FMEA during design phases for new BioGas processing equipment or when you implement significant process changes. It works best for systems where failures carry serious consequences like safety risks, environmental violations, or expensive downtime. If you're installing a new catalytic reactor or modifying your desulphurisation process, FMEA helps you spot vulnerabilities before commissioning.
How to run it step by step
Start by assembling a cross-functional team with design engineers, operators, and maintenance staff. Break your system into components or process steps, then brainstorm every conceivable failure mode for each. Score severity (1-10), occurrence (1-10), and detection (1-10), calculating the risk priority number for each failure mode. Rank all modes by RPN and develop action plans for the highest scores, focusing on reducing severity, occurrence, or improving detection.
Teams that complete FMEA before launching new equipment catch design flaws that would otherwise generate costly failures in production environments.
How to validate causes and actions
Validate by having independent reviewers challenge your severity and occurrence scores to prevent optimism bias. After you implement improvements, recalculate RPNs to confirm they dropped significantly. Track actual failure rates post-launch to verify your occurrence predictions were accurate and your controls work as designed.
Cost, effort, and pitfalls
Conducting a thorough FMEA requires four to eight hours of team time per system or process, with no software cost if you use spreadsheet templates. The biggest pitfall is rushing through scoring without genuine debate, which produces inaccurate RPNs that prioritize the wrong risks and waste your prevention budget.
5. Fault tree analysis
Fault tree analysis (FTA) works backward from a specific failure event to map all possible contributing causes in a logical diagram. Unlike fishbone diagrams that organize brainstormed ideas, FTA uses Boolean logic gates (AND, OR) to show exactly how individual failures combine to produce system-level problems. This makes it one of the best root cause analysis tools for complex BioGas systems where multiple components must fail simultaneously to create incidents.
What it is
FTA creates a visual tree where the top event (your undesired outcome) sits at the peak and branches downward through intermediate events to basic causes at the bottom. Each branch uses logic gates: an AND gate means all inputs must occur together, while an OR gate means any single input triggers the result. You calculate failure probabilities by combining individual component rates through these gates.
When to use it
Choose FTA when investigating safety-critical failures or events that require multiple simultaneous conditions. If you need to prove that redundant systems actually prevent problems, or when regulatory compliance demands quantified risk assessment, fault tree analysis provides the mathematical rigor other methods lack.
How to build the tree and logic gates
Start by defining your top event precisely (for example, "BioMethane purity drops below 97% CH4"). Work downward asking what immediate causes could produce that event, connecting them with appropriate logic gates. Continue branching until you reach basic events that represent component failures or human errors with known probability data.
Fault trees transform vague failure discussions into precise logical relationships that reveal exactly which component combinations create your biggest risks.
How to validate causes and actions
Validate by having independent engineers review your logic gate choices and verify you didn't miss causal pathways. Test whether eliminating high-probability basic events actually reduces calculated top event likelihood. Compare predicted failure rates against historical data to confirm your tree accurately models reality.
Cost, effort, and pitfalls
Building a comprehensive fault tree requires six to twelve hours of engineering time for moderately complex systems, using free software or drawing tools. The main pitfall is stopping too early in your branching, which produces incomplete models that miss critical failure combinations hiding in lower tree levels.
6. Affinity diagrams
Affinity diagrams help you organize hundreds of scattered observations into logical groups when a problem has no obvious starting point. If your team collected feedback from operators, reviewed sensor logs, interviewed maintenance staff, and photographed equipment conditions, you're left with a jumbled pile of inputs that needs structure before analysis can begin.
What it is
This method takes individual pieces of information written on sticky notes or cards and groups them into natural clusters based on relationships your team discovers. You don't start with predetermined categories. Instead, you let themes emerge organically as team members move notes around and debate which items belong together, creating a bottom-up structure from raw data.
When to use it
Apply affinity diagramming when you're investigating complex problems with input from multiple sources or when root causes aren't immediately obvious. This works particularly well for BioGas processing issues that span equipment, procedures, and human factors, where traditional analysis frameworks feel too rigid to capture the problem's full scope.
How to turn messy inputs into clear themes
Start by writing each observation, symptom, or data point on a separate sticky note. Spread all notes on a wall or large table where your team can see everything simultaneously. Silently move notes into groups that feel related, then discuss and refine clusters until consensus emerges. Label each group with a descriptive header that captures the theme, creating a structured map from chaos.
When you let patterns reveal themselves instead of forcing data into preset categories, you often discover connections that structured methods would miss.
How to validate causes and actions
Validate by checking whether each theme contains enough evidence to justify investigation and whether the grouped items truly relate or just superficially resemble each other. Test your themes by asking whether addressing the highest-priority clusters would eliminate multiple symptoms simultaneously, confirming you identified real causal relationships.
Cost, effort, and pitfalls
Running an affinity session requires two to four hours of team time plus sticky notes and wall space, making it one of the most accessible best root cause analysis tools available. The biggest pitfall is letting dominant personalities force artificial groupings instead of allowing natural patterns to emerge through collaborative discussion.
What to do after you pick your tools
Choosing among the best root cause analysis tools matters less than actually using them consistently. You need to train your team on the selected methodology, establish clear investigation triggers, and review findings regularly to spot patterns across multiple incidents. Document your RCA process in standard operating procedures so new engineers follow the same approach, creating comparable data over time.
The real value emerges when you close the loop by tracking whether implemented corrective actions actually eliminate problems. Schedule follow-up reviews three to six months after major investigations to verify your solutions worked as intended. If your BioGas processing operation demands the same precision engineering that went into designing your equipment, systematic problem-solving separates sustainable operations from chronic firefighting.
At 99pt5, we build BioTreater™ systems that guarantee 99.5% BioMethane recovery through engineered reliability, but even the most rugged petroleum-industry-grade equipment benefits from disciplined root cause analysis when issues arise. Explore how our integrated approach combines proven engineering with operational excellence.