Carbon Intensity of Renewable Natural Gas: Facts & Methods
Learn how the carbon intensity of renewable natural gas impacts project revenue. Explore calculation methods, feedstock ranges, and design strategies to maximize credits & returns.
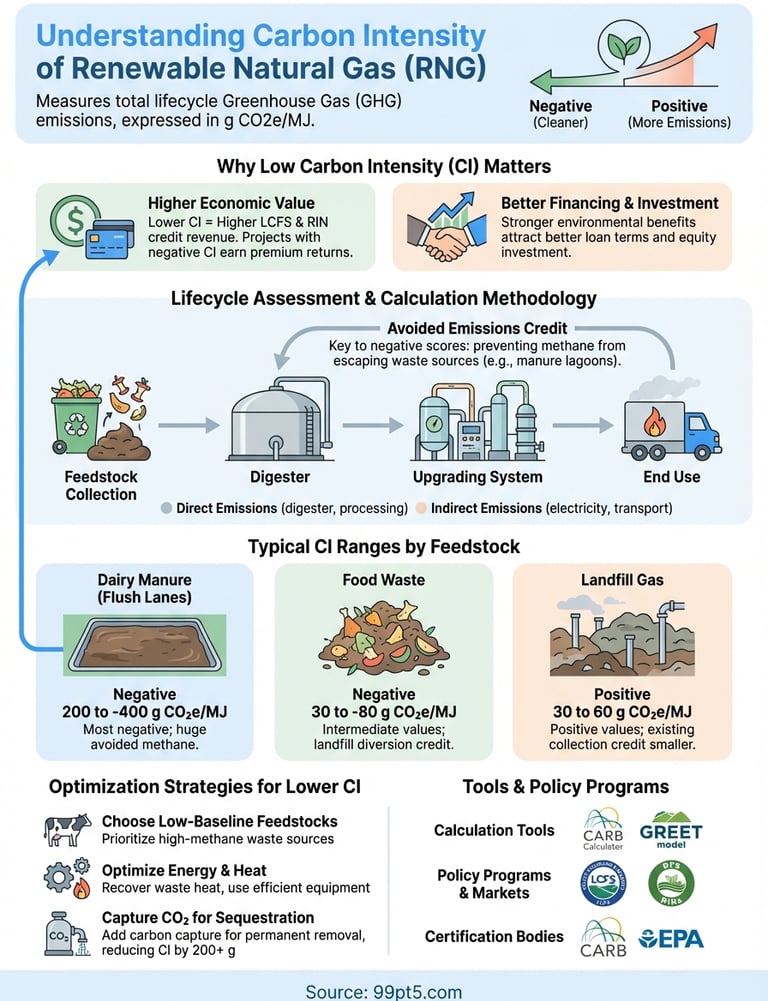
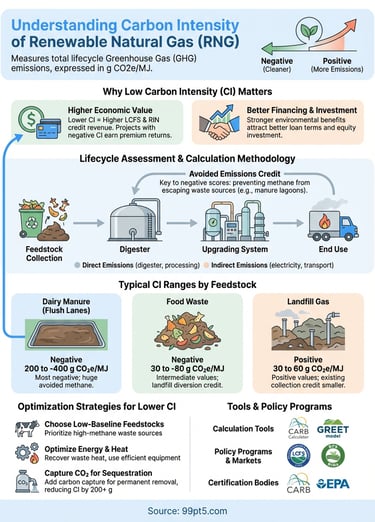
Carbon intensity of renewable natural gas measures the total greenhouse gas emissions produced throughout its entire lifecycle, from feedstock collection to final combustion. You see this expressed as grams of CO2 equivalent per megajoule of energy. Some RNG pathways actually deliver negative carbon intensity values because they prevent methane emissions that would otherwise escape into the atmosphere from manure lagoons or landfills. This metric determines the economic value of your RNG project under programs like California's Low Carbon Fuel Standard and the federal Renewable Identification Number system, where lower carbon intensity translates directly into higher credit values and better project returns.
This article breaks down how carbon intensity works for RNG projects. You'll learn the calculation methodology used by regulatory bodies, see typical carbon intensity ranges for different feedstocks like dairy manure and landfill gas, and understand which design choices drive your numbers down. We cover the policy programs that reward low carbon intensity, the tools available for calculating your project's specific values, and practical strategies for optimizing your system from day one. Whether you're building a small farm digester or a large industrial facility, these facts and methods help you maximize both environmental impact and revenue.
Why carbon intensity of RNG matters
Your RNG project's carbon intensity number determines its profitability. Regulators assign credit values based on how much cleaner your fuel is compared to fossil natural gas, and these credits often generate more revenue than the gas itself. A dairy manure project with a carbon intensity of negative 300 grams CO2e per megajoule earns substantially higher returns than a landfill project at positive 50 grams. This difference translates into thousands of dollars per million BTUs sold into compliance markets, making carbon intensity the single most important design consideration for your financial model.
Economic value in credit markets
California's Low Carbon Fuel Standard pays you based on your carbon intensity score. Projects with negative carbon intensity values earn credits for every unit of RNG they inject into the pipeline because they prevent methane emissions that would otherwise escape. The federal RIN program similarly rewards lower carbon intensity fuels with higher D3 RIN values, though it calculates benefits on a volumetric rather than intensity basis. These credit markets create revenue streams that can exceed $20 per million BTUs for dairy manure projects, compared to the natural gas commodity price of around $3 to $5 per million BTU. Your carbon intensity determines whether your project achieves breakeven in three years or ten.
Lower carbon intensity scores unlock premium pricing in compliance markets, often generating five times more revenue than the fuel commodity itself.
Project financing and investment decisions
Banks and investors review your carbon intensity projections before committing capital to your RNG facility. Lower numbers prove stronger environmental benefits and signal higher revenue certainty from credit programs. Financial institutions understand that projects with dairy manure feedstock and carbon intensities below negative 200 grams qualify for maximum incentives under current regulations. They also recognize that carbon intensity of renewable natural gas directly affects your eligibility for additional funding sources like the Inflation Reduction Act's Investment Tax Credit. Projects that can demonstrate and guarantee low carbon intensity through certified pathways receive better loan terms, attract more equity investment, and achieve financial close faster than those with uncertain or marginal intensity values.
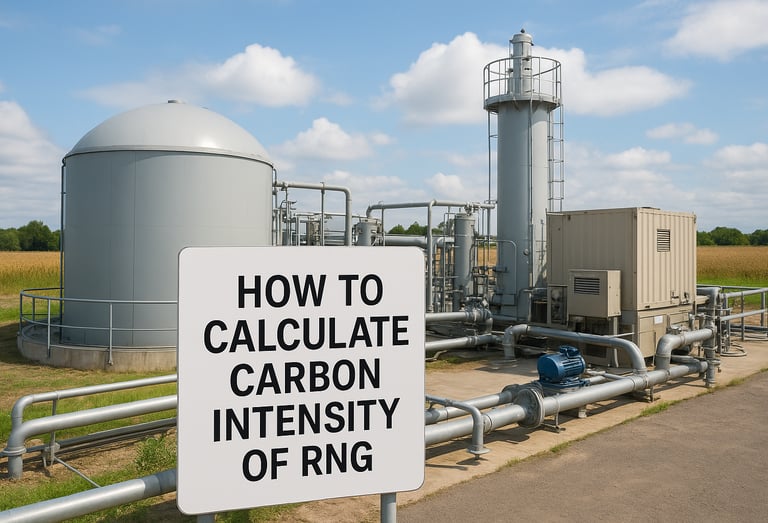
How to calculate carbon intensity of RNG
You calculate the carbon intensity of renewable natural gas by measuring all greenhouse gas emissions across the entire production chain, from feedstock collection through final combustion, then dividing by the energy content delivered. Regulators use lifecycle assessment methodology that accounts for every emission source, including methane leakage, electricity consumption, and transportation fuel. The key difference from fossil fuel calculations is the avoided emissions credit you receive for preventing methane that would otherwise escape from waste sources. This credit often pushes your final carbon intensity score into negative territory, meaning your RNG actually removes more greenhouse gases from the atmosphere than it emits.
Lifecycle assessment boundaries
Your carbon intensity calculation starts where organic waste enters your system and ends when the purified RNG burns in an engine or furnace. Between these points, you track direct emissions from digesters, upgrading equipment, and compressors, plus indirect emissions from purchased electricity and any fossil fuels used in operations. The assessment includes emissions from collecting and transporting feedstock to your site, operating the anaerobic digester, processing raw biogas into pipeline-quality methane, and distributing the final product. You also measure methane slip from your upgrading system and any CO2 vented during purification steps.
Boundary definitions determine which emissions count toward your final score. Projects that capture and sell CO2 as a separate product reduce their carbon intensity because sequestered carbon dioxide never reaches the atmosphere. Similarly, if you use waste heat from compression to warm your digester, you avoid emissions from a conventional boiler and lower your overall intensity value. Regulators specify exactly which processes fall inside your assessment boundary, and you must follow these definitions precisely to maintain pathway certification and credit eligibility.
Key emission sources tracked
Your digester itself produces minimal direct emissions because the system captures methane in a controlled environment. The upgrading process generates most of your on-site emissions when you separate CO2 from CH4 and vent it to atmosphere or flare excess gas. Equipment like compressors, blowers, and control systems consume electricity, and the carbon intensity of your power source directly affects your final score. Using grid electricity in a coal-heavy region adds more emissions than operating in an area with renewable power generation.
Transportation emissions matter when you haul feedstock from multiple collection points to your central digester. Dairy manure projects with on-site digesters eliminate these transport emissions entirely, while facilities processing food waste from restaurants or separated organics from municipal programs must account for every truck mile. The model also tracks fugitive methane emissions from pipeline leaks, equipment seals, and pressure relief valves throughout your gas processing train.
Avoided emissions credit
The avoided emissions calculation determines whether your project achieves negative carbon intensity values. You receive credit for methane your system prevents from escaping into the atmosphere in a baseline scenario without your digester. Dairy manure stored in open lagoons naturally releases methane as bacteria break down organic matter, and each cubic meter of prevented methane equals 25 times more warming potential than the same volume of CO2. Landfills similarly emit methane from decomposing waste, though facilities with existing gas collection systems receive smaller avoided emission credits because they already capture some methane.
Avoided emission credits account for methane your digester captures that would otherwise escape from waste lagoons or landfills, often creating negative carbon intensity scores.
Regulatory agencies establish baseline emission factors for each feedstock type based on standard industry practices. Your dairy manure project claims credits for all methane that would have bubbled from lagoon surfaces without your digester, while landfill projects only claim credit for methane that existing collection systems would miss. This baseline methodology explains why identical digesters processing different feedstocks achieve vastly different carbon intensity scores, with animal manure delivering the most negative values.
Typical carbon intensity ranges by feedstock
Different organic waste sources produce renewable natural gas with vastly different carbon intensity values. Your feedstock choice determines whether your project achieves carbon-negative performance or simply reduces emissions compared to fossil fuels. Regulatory agencies like California Air Resources Board publish certified pathway carbon intensities that range from negative 300 grams CO2e per megajoule for dairy manure to positive 50 grams for landfill gas. These numbers reflect the baseline methane emissions your digester prevents, the energy required for processing, and the direct emissions from your operations. Understanding these ranges helps you select the right feedstock and predict your revenue potential from credit markets.
Dairy and livestock manure pathways
Dairy manure delivers the most negative carbon intensity of renewable natural gas among all feedstock types. Projects processing cow manure from lagoon storage systems achieve carbon intensity values between negative 200 and negative 400 grams CO2e per megajoule because they prevent massive methane emissions that would otherwise escape from open lagoons. Each ton of manure your digester processes captures methane with 25 times the warming potential of carbon dioxide, creating substantial avoided emission credits. California's certified pathways show dairy projects consistently scoring below negative 300 grams, making them the most valuable in LCFS credit markets.
Swine and poultry manure also generate negative carbon intensities, though typically less negative than dairy because these operations often use different manure management systems with lower baseline methane emissions. Swine projects achieve values around negative 150 to negative 250 grams, while poultry operations range from negative 100 to negative 200 grams depending on whether the baseline scenario involves dry litter or liquid handling systems.
Dairy manure projects deliver carbon intensity values 6 to 8 times lower than fossil natural gas, often reaching negative 300 grams CO2e per megajoule or better.
Landfill gas pathways
Landfill-derived RNG produces positive carbon intensity values because existing gas collection systems already capture much of the baseline methane emissions. Your landfill project typically achieves carbon intensity between 30 and 60 grams CO2e per megajoule, roughly half the emissions of fossil natural gas at 90 to 100 grams. These higher scores reflect the fact that municipal solid waste landfills must install methane collection systems by law, so your upgrading facility receives credit only for the methane that would escape despite existing controls.
Sites without mandatory collection systems or older landfills with less effective capture equipment can achieve slightly lower carbon intensities in the 20 to 40 gram range. The calculation accounts for collection efficiency, methane oxidation in soil cover, and the energy consumed by your upgrading process. Even at positive values, landfill RNG delivers substantial emissions reductions compared to fossil fuels and qualifies for federal RIN credits.
Food waste and wastewater pathways
Source-separated food waste from restaurants, grocery stores, and food processing facilities delivers carbon intensity between negative 30 and negative 80 grams CO2e per megajoule. These intermediate values reflect the avoided methane from landfill diversion and the emissions from collecting and transporting organic material to your digester. Projects that co-digest food waste with manure often achieve better scores because they increase biogas yield per ton of manure while maintaining the dairy baseline credit.
Wastewater treatment plant digesters processing biosolids achieve carbon intensity around 30 to 40 grams CO2e per megajoule. Municipal wastewater facilities already operate digesters for solids treatment, so the avoided emissions credit is smaller than fresh organic waste projects. Your carbon intensity improves when you upgrade existing digester gas rather than flaring it, but values remain positive because baseline methane emissions are low.
Design RNG projects for low carbon intensity
Your design choices directly control the carbon intensity of renewable natural gas your facility produces. Selecting the right feedstock establishes your baseline avoided emissions, while equipment decisions and operational strategies determine the actual emissions your system generates. Projects that prioritize low carbon intensity from the conceptual design phase achieve better credit revenues and stronger financial returns than those that retrofit efficiency measures later. You can reduce your final carbon intensity score by 50 to 100 grams through strategic design decisions that cost little or nothing to implement during initial construction.
Choose low-baseline feedstocks
Your feedstock selection makes the biggest impact on final carbon intensity values. Dairy manure from flush-lane lagoon systems delivers the most negative scores because these operations release massive amounts of methane without your digester. Projects that source manure from scraped barns or composted solids receive smaller avoided emission credits because baseline methane generation is lower. If you have access to multiple feedstock sources, prioritize those with the highest uncontrolled methane emissions in their baseline scenario to maximize your avoided emission credits.
Co-digestion strategies let you improve carbon intensity while increasing gas production. Mixing dairy manure with food waste or crop residues boosts your biogas yield per ton of feedstock without significantly changing your avoided emission calculation, because you still claim the full dairy baseline credit. The additional organic material dilutes the carbon intensity across a larger energy output, effectively reducing your grams of CO2e per megajoule. Verify that your regulatory pathway allows co-digestion and maintains your dairy manure classification to preserve the avoided emission benefits.
Strategic feedstock selection accounts for 60 to 80 percent of your final carbon intensity score, making it the most critical design decision for project economics.
Optimize energy consumption
Your upgrading technology determines how much electricity and thermal energy your facility consumes. Systems that use membrane separation or pressure swing adsorption typically require less power than water scrubbing systems, directly reducing the indirect emissions component of your carbon intensity calculation. Right-sizing your equipment prevents over-compression and unnecessary energy waste throughout the gas processing train. Projects that operate with fewer compression stages and lower pressure differentials achieve better efficiency and lower carbon scores.
Heat integration cuts both operating costs and carbon intensity. Your compression process generates substantial waste heat that you can recover for digester warming or facility heating, displacing natural gas or propane consumption. Each megajoule of avoided fossil fuel combustion reduces your carbon intensity by approximately 60 to 70 grams of CO2e. Install heat exchangers on compressor discharge streams and route hot water through digester heating jackets to maximize thermal recovery without additional equipment costs.
Capture CO2 for sequestration or sale
Adding carbon capture equipment transforms your upgrading system from a methane purification unit into a negative emissions facility. When you compress and liquefy the CO2 separated during upgrading instead of venting it, you remove greenhouse gases from the atmosphere permanently. Projects that inject captured CO2 into geological storage formations or sell it for permanent sequestration applications can reduce carbon intensity by 200 grams or more compared to conventional venting.
Food and beverage manufacturers, concrete curing operations, and enhanced oil recovery projects all purchase CO2 at prices between $40 and $100 per ton. Your capture system adds capital cost but generates additional revenue streams while improving your carbon intensity score. Verify that your end-use application qualifies as permanent sequestration under regulatory guidelines to receive full carbon intensity benefits and maintain credit eligibility.
Tools, standards and policy programs
Regulatory agencies and third-party organizations provide the tools and frameworks you need to calculate, certify, and monetize your RNG project's carbon intensity. These resources range from free online calculators to comprehensive modeling software used by certification bodies. Understanding which standards apply to your project and which credit markets you can access determines your revenue potential and compliance obligations. Most developers work with specialized consultants for initial pathway certification, but you can use preliminary tools to estimate values during feasibility studies.
Carbon intensity calculation tools
The California Air Resources Board's Fuel Lifecycle Carbon Intensity Calculator lets you model different RNG production pathways using their regulatory methodology and assumptions. You input feedstock type, digester design, upgrading technology, and energy sources to generate preliminary carbon intensity estimates. The model includes default values for most variables, so you can quickly compare different configuration options before finalizing your design. Projects selling into California's LCFS market must eventually submit formal applications with site-specific operational data, but this calculator provides reliable planning numbers.
Argonne National Laboratory maintains GREET, a comprehensive lifecycle analysis tool that models energy pathways from well to wheels. This software calculates carbon intensity for renewable fuels using detailed process models and emission factors. While GREET requires more technical expertise than simplified calculators, it produces results accepted by federal agencies for RIN pathway applications. Your engineering team can use GREET to optimize system design for minimum carbon intensity before submitting formal pathway certifications.
Certification and pathway standards
California Air Resources Board certifies RNG pathways that establish your official carbon intensity score for LCFS credit generation. You submit detailed engineering documentation showing feedstock sources, baseline emissions, process equipment, energy consumption, and avoided methane calculations. CARB reviews your application and assigns a certified carbon intensity value that remains valid until you modify operations or regulations change. Projects without certified pathways cannot claim LCFS credits, making certification essential for market access in California and other states with similar programs.
Pathway certification establishes your legally binding carbon intensity score that determines credit value across all compliance markets.
The EPA certifies RIN-generating pathways under the Renewable Fuel Standard program. Your facility must demonstrate that biogas derives from eligible feedstocks and meets renewable biomass definitions in federal regulations. EPA certification focuses on feedstock eligibility and production process verification rather than specific carbon intensity calculations, since RINs generate on a volumetric basis. Both CARB and EPA certifications require annual reporting and periodic audits to maintain your approved pathway status.
Policy programs using carbon intensity metrics
California's Low Carbon Fuel Standard creates the primary market for low carbon intensity RNG in North America. Fuel providers must reduce the average carbon intensity of transportation fuels sold in California by specific percentages each year. Your RNG generates tradeable credits based on how much your carbon intensity of renewable natural gas undercuts the annual benchmark. Projects with negative carbon intensity values earn maximum credits, translating directly into premium pricing.
Oregon's Clean Fuels Program and Washington's Clean Fuel Standard operate similar markets with their own carbon intensity benchmarks and credit values. British Columbia's Low Carbon Fuel Standard also rewards low-carbon RNG, expanding your potential customer base beyond California. Federal RIN markets provide additional revenue through D3 credits for cellulosic biofuel, though these calculate on volume rather than carbon intensity.
Bringing it all together
The carbon intensity of renewable natural gas determines both your environmental impact and project profitability. Lower carbon intensity values unlock premium pricing in compliance markets, better financing terms, and stronger long-term returns. Your feedstock choice establishes the foundation, with dairy manure delivering the most negative scores through avoided methane emissions. Design decisions around energy efficiency, heat recovery, and CO2 capture further optimize your numbers by reducing operational emissions.
Accurate calculation and pathway certification let you access LCFS credits, federal RINs, and other revenue streams that often exceed commodity gas pricing. Projects that prioritize low carbon intensity from conceptual design through commissioning consistently outperform facilities retrofitted later. 99pt5's BioTreater system delivers guaranteed 99.5% methane recovery and 99.5% CO2e emission reduction, combining petroleum industry engineering with efficient biogas processing to maximize both your carbon credits and cash returns from day one.