Cradle To Grave Life Cycle Assessment: Stages And Scope
Master the five stages of a cradle to grave life cycle assessment. Learn how to track impacts, satisfy audits, and avoid reporting errors for renewable projects.
When companies in the BioMethane sector claim environmental benefits, those claims need solid backing. A cradle to grave life cycle assessment provides exactly that, a complete picture of environmental impact from raw material extraction through final disposal. For BioGas processing equipment providers and their clients, understanding this framework isn't optional; it's essential for accurate carbon reporting and credible ESG disclosures.
At 99pt5, our BioTreater™ system delivers guaranteed 99.5% CO2e emission reduction, but that number only tells part of the story. The full environmental picture emerges when you assess every stage, from manufacturing the equipment to operating it, and eventually decommissioning it. This is where cradle to grave analysis becomes invaluable for companies seeking to demonstrate genuine sustainability rather than greenwashed claims.
This article breaks down the specific stages of a cradle to grave LCA, explains its scope compared to other assessment boundaries like cradle to gate and cradle to cradle, and shows why this methodology matters for carbon credit validation and regulatory compliance. Whether you're building a case for project financing or preparing environmental documentation for end-clients, you'll walk away with a clear understanding of how comprehensive lifecycle thinking applies to BioMethane operations.
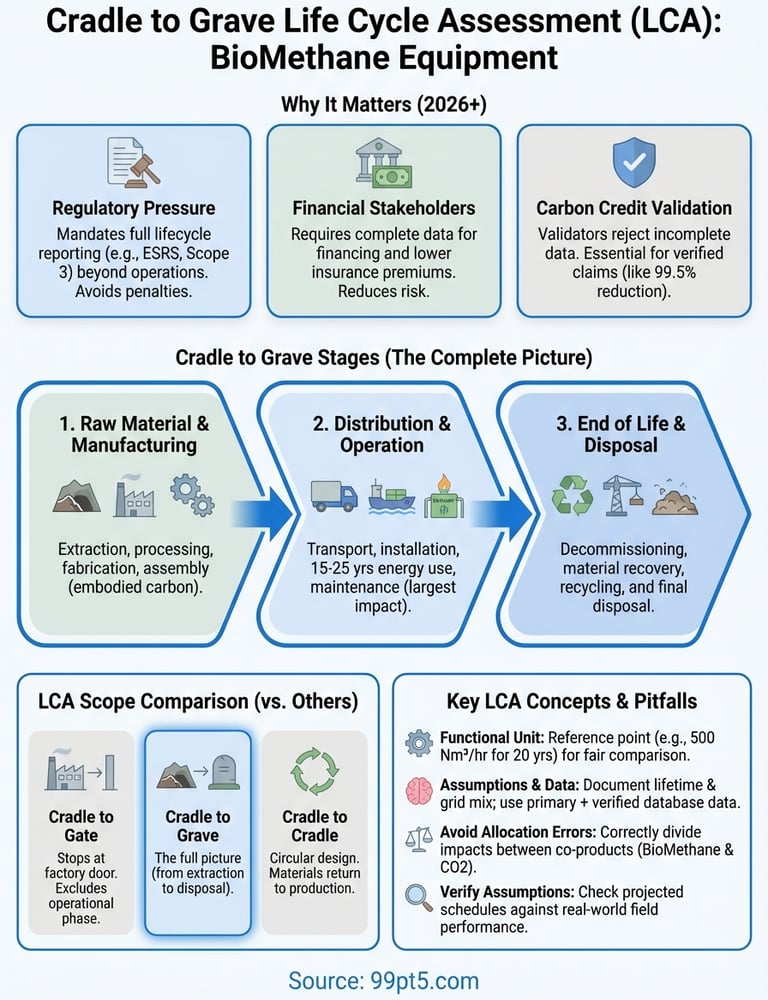
Why cradle-to-grave LCA matters in 2026
You face mounting pressure to prove your environmental claims with verifiable data, not estimates or promotional statements. In 2026, investors, regulators, and end-clients demand comprehensive lifecycle assessments before signing contracts or approving financing for BioMethane projects. A cradle to grave life cycle assessment delivers the complete environmental picture that partial assessments can't provide, covering every stage from equipment manufacturing through decades of operation and eventual decommissioning.
Regulatory pressure drives thorough documentation
New disclosure requirements across Europe and North America now mandate complete lifecycle reporting for energy infrastructure projects, including BioGas processing systems. You can't satisfy these regulations by measuring only operational emissions or cherry-picking favorable data points. The European Sustainability Reporting Standards (ESRS), implemented in 2024 and now fully enforced, specifically require Scope 3 accounting that includes upstream and downstream impacts. Without a full cradle to grave assessment, your clients risk non-compliance penalties and project delays that directly affect your reputation as a solutions provider.
Carbon credit validation bodies have tightened their standards significantly. When your clients apply for credits based on emission reductions, validators now routinely reject applications that lack comprehensive lifecycle data. They want to see the full carbon footprint, including the embodied carbon in equipment manufacturing, transportation impacts, ongoing maintenance materials, and end-of-life disposal. Projects that claimed 99.5% emission reduction in 2022 based on operational data alone now need to prove that figure holds up when you account for the entire lifecycle from extraction to disposal.
The difference between a validated carbon credit application and a rejected one often comes down to whether you conducted a complete cradle to grave assessment versus a limited operational analysis.
Market differentiation through transparent performance
Your competitors claim environmental benefits using vague metrics and incomplete boundaries. You gain a competitive advantage when you present clients with independently verified, comprehensive lifecycle data that includes every stage of equipment impact. Companies building complete Organics to BioMethane systems need suppliers who can provide detailed LCA documentation for each component, especially the processing equipment that represents the largest capital investment and longest operational lifespan in their systems.
Procurement teams at industrial facilities and agricultural operations now include sustainability specialists who evaluate vendors based on lifecycle thinking. These specialists ask specific questions about manufacturing processes, operational efficiency over time, maintenance requirements, and decommissioning plans. When you provide cradle to grave LCA results, you demonstrate that your equipment has been thoroughly evaluated against industry best practices, not just tested in ideal laboratory conditions.
Financial stakeholders require complete impact data
Banks and investment funds financing BioMethane projects evaluate environmental risk as carefully as financial risk in 2026. They know that projects with inflated environmental claims face regulatory challenges, reputational damage, and potential stranded asset problems down the line. Lenders now routinely request complete lifecycle assessments before approving project financing, particularly for equipment with 15 to 25-year operational lifespans like BioGas processing systems. A thorough cradle to grave assessment reassures financial stakeholders that the projected carbon credits and environmental benefits will materialize throughout the project lifecycle.
Insurance underwriters have also shifted their approach. They charge higher premiums for projects that lack comprehensive lifecycle documentation because those projects carry greater regulatory and reputational risk. When you provide end-clients with complete LCA data for your equipment, you help them secure better financing terms and lower insurance costs, which directly improves project economics and makes your solutions more attractive compared to suppliers offering only partial environmental assessments.
What cradle-to-grave LCA includes stage by stage
A cradle to grave life cycle assessment breaks down into five distinct stages that track environmental impact from initial resource extraction through final disposal. For BioGas processing equipment like the BioTreater™ system, each stage contributes differently to the overall carbon footprint, and you need accurate data from all phases to calculate the true 99.5% CO2e emission reduction that your clients can legitimately claim for carbon credit applications.
Raw material extraction through manufacturing
The first stage captures impacts from mining metals, extracting raw materials, and processing them into usable components. Your equipment contains stainless steel vessels, specialized catalysts, compression components, and control systems, each with its own extraction footprint. Steel production alone generates significant CO2e emissions during ore processing and smelting operations, while catalyst manufacturing involves energy-intensive chemical processes that must be included in your total lifecycle calculation.
Manufacturing takes these materials and transforms them into finished equipment through cutting, welding, machining, and assembly operations. You account for electricity consumption at fabrication facilities, transportation between suppliers and assembly plants, and any process emissions from surface treatments or protective coatings. The compact design of the BioTreater™ system actually provides an advantage here because smaller equipment requires less material input and shorter manufacturing cycles compared to larger, less efficient processing units.
Distribution and operational phase
Transportation from manufacturing facilities to installation sites generates emissions based on distance traveled, shipping method, and equipment weight. Your modular units ship more efficiently than competitors' bulkier systems, reducing this stage's contribution to the overall footprint. Installation impacts include site preparation, foundation work, and initial commissioning energy required to bring the system online.
The operational phase typically represents the longest duration in the lifecycle, spanning 15 to 25 years for BioGas processing equipment. You measure ongoing energy consumption, routine maintenance materials, catalyst replacement schedules, and any refrigerants or working fluids that need periodic replenishment. This stage also captures the positive impacts, specifically the avoided emissions from processing raw BioGas into clean BioMethane instead of releasing it or flaring it.
The operational phase accounts for the largest portion of lifecycle impacts in most processing equipment, making guaranteed efficiency critical to overall environmental performance.
End of life and disposal
The final stage addresses decommissioning activities, equipment disassembly, material recovery through recycling, and disposal of components that can't be recovered. Stainless steel vessels have high recycling value, while specialized components like catalysts require specific handling procedures. You include transportation to recycling facilities and the energy required for material recovery processes that return steel and other metals to the supply chain for reuse in new equipment manufacturing.
How cradle-to-grave differs from other LCA scopes
Your assessment boundary determines which impacts you measure and which you exclude, creating fundamentally different environmental profiles for the same equipment. Three common LCA scopes exist beyond cradle to grave, each with specific applications and limitations that you need to understand when evaluating BioGas processing equipment. Choosing the wrong boundary leads to incomplete carbon accounting that undermines carbon credit applications and fails to satisfy regulatory disclosure requirements.
Cradle to gate stops at factory door
A cradle to gate analysis measures impacts from raw material extraction through the point when finished equipment leaves the manufacturing facility. This boundary excludes transportation to your site, installation activities, operational energy consumption, maintenance materials, and end-of-life disposal. Suppliers often prefer cradle to gate reporting because it shows only the impacts they directly control while excluding the operational phase where equipment performance varies based on how clients configure and operate systems.
You encounter this boundary frequently in environmental product declarations (EPDs) that manufacturers publish for building materials and industrial equipment. The limitation becomes obvious when you compare two BioGas processing units: one with lower manufacturing emissions but poor operational efficiency, and another with higher manufacturing emissions but superior performance over 20 years. Cradle to gate assessment favors the first unit despite worse lifetime environmental impact.
Cradle to cradle emphasizes circular design
Cradle to cradle assessment extends beyond disposal to track how materials return to production cycles through recycling and remanufacturing. This approach evaluates whether your equipment design facilitates material recovery at end of life, turning waste into valuable inputs for new manufacturing rather than sending materials to landfills. You see cradle to cradle principles applied most often in consumer products and packaging, though industrial equipment increasingly adopts this framework.
The practical difference appears in how you design equipment for disassembly, material separation, and component reuse. Stainless steel vessels in the BioTreater™ system have high recovery value, but specialized components like catalysts require careful handling to reclaim valuable materials while safely processing hazardous constituents. Cradle to cradle assessment rewards designs that maximize material circularity instead of treating disposal as the final stage.
The choice between assessment boundaries isn't academic; it directly affects which environmental claims you can defend during carbon credit audits and regulatory reviews.
When partial boundaries mislead stakeholders
Gate to gate analysis isolates a single process step, measuring only what happens inside one facility or operational stage. While useful for internal process optimization, this narrow boundary provides no context for overall lifecycle impact. Your clients need cradle to grave life cycle assessment results to satisfy financing requirements and regulatory disclosures, not isolated manufacturing data that obscures the complete environmental picture across decades of operation.
Partial boundaries become problematic when suppliers present cherry-picked data that highlights favorable stages while excluding problematic ones. You protect your reputation by insisting on complete cradle to grave assessments that include operational performance guarantees, maintenance requirements, and end-of-life planning instead of accepting incomplete manufacturer claims about environmental benefits.
How to set system boundaries and key assumptions
You establish the foundation of your cradle to grave life cycle assessment by defining exactly what you include and what you exclude from your analysis. System boundaries act as the perimeter around your study, determining which processes, materials, and impacts you measure while key assumptions fill gaps where precise data doesn't exist or where simplified models represent complex real-world conditions. Getting these definitions right at the start prevents scope creep during analysis and ensures that your results answer the specific questions your clients ask about BioMethane equipment performance.
Define what enters and exits your analysis
Your boundary decision starts with the functional unit, the reference point against which you measure all impacts. For BioGas processing equipment, you typically express this as processing capacity over time, such as treating 500 Nm³/hour of raw BioGas for 20 years of operation. This unit allows you to compare different equipment options on an equal basis rather than simply totaling emissions without context for the work performed.
Inputs crossing your boundary include raw materials for equipment manufacturing, energy consumed during fabrication and operation, maintenance materials throughout the service life, and transportation fuel for delivery and component replacements. Outputs include the purified BioMethane product, captured CO2, waste materials from catalyst replacement, and emissions generated at each lifecycle stage. You explicitly state which ancillary processes you include, such as catalyst production or control system manufacturing, and which you exclude because they contribute less than a defined threshold to total impacts.
Clear boundary definitions prevent disputes during carbon credit audits by establishing exactly which impacts you claim responsibility for measuring and which fall outside your assessment scope.
Document assumptions that shape your results
Your assumptions address data gaps and modeling decisions that significantly influence final results. You state the assumed equipment lifetime, typically 15 to 25 years for BioGas processing systems, and justify this estimate based on material durability studies and operational experience with similar equipment. Maintenance schedules become assumptions when you project future replacement cycles for catalysts, filters, and wearing components based on current performance data rather than verified long-term field results.
Energy grid assumptions dramatically affect operational phase impacts. You specify whether you use current grid carbon intensity or project future improvements as electricity generation shifts toward renewables over your equipment's operational lifetime. Transportation distances from suppliers to manufacturing facilities and from factories to installation sites require assumptions when you analyze equipment not yet deployed to specific locations. Each assumption gets documented with its source, rationale, and sensitivity analysis showing how results change if the assumption proves incorrect by 10%, 25%, or 50%.
How to collect the right data across the lifecycle
Data collection determines whether your cradle to grave life cycle assessment produces credible results or questionable estimates that fail carbon credit audits. You need specific, verifiable data from each lifecycle stage rather than generic industry averages that obscure the actual performance differences between your BioTreater™ system and competing equipment. Your data collection strategy must balance the need for precise measurements against practical constraints like access to supplier information and the cost of conducting detailed field studies across multiple sites.
Identify primary data sources at each stage
You start by securing manufacturer data for the equipment itself, including material bills that list every component by weight, type, and supplier origin. Your fabrication partner provides energy consumption records from welding, machining, and assembly operations along with transportation manifests showing how far raw materials traveled to reach the manufacturing facility. This primary data eliminates guesswork about the manufacturing phase and provides the foundation that you build upon with operational measurements.
Operational data comes directly from installed systems through monitoring equipment that tracks energy consumption, maintenance activities, and process efficiency over time. You collect readings on electricity usage, catalyst replacement schedules, refrigerant additions, and any consumables needed to maintain guaranteed performance levels. The BioView™ remote monitoring system captures this data automatically, giving you continuous performance records rather than periodic snapshots that might miss important variations in energy consumption or maintenance requirements across different operating conditions and feedstock qualities.
Direct measurements from operating equipment always carry more weight during carbon credit validation than industry averages or manufacturer estimates based on laboratory testing.
Use industry databases for background processes
LCA databases like Ecoinvent or GaBi provide standardized data for common background processes that you don't directly control, such as steel production, electricity grid mix, or transportation fuel refining. You reference these databases for upstream impacts where collecting primary data from every supplier in your material supply chain becomes impractical. The database values represent industry averages that you apply to your specific material quantities and energy consumption figures from primary data collection.
Data quality matters more than data quantity. You document the source, age, and geographic relevance of every data point in your assessment, noting whether you used measured values from your equipment or estimated values from database references. This documentation protects your results during third-party reviews by showing exactly where each number originated and why you selected particular database entries when multiple options existed for the same background process.
How to read results and avoid common LCA mistakes
Your cradle to grave life cycle assessment generates multiple impact categories beyond simple carbon footprint, and misreading these results leads to flawed decisions about equipment selection and environmental claim validation. You need to interpret each metric correctly while watching for common errors that invalidate assessments, particularly mistakes around system boundary inconsistencies, allocation choices, and assumption validation. Understanding where assessments typically go wrong protects your clients from rejected carbon credit applications and helps you spot questionable claims when competitors present environmental performance data.
Interpret impact categories correctly
You receive results broken down by impact category, not just total CO2e emissions. Global warming potential represents the carbon footprint everyone focuses on, but your assessment also measures acidification, eutrophication, ozone depletion, and resource depletion across the equipment lifecycle. Each category uses different units and reference standards, so you can't simply add them together or compare values directly across categories without understanding what each measurement represents.
BioGas processing equipment typically shows the largest impacts in global warming potential during the operational phase and in resource depletion during manufacturing when you extract metals for vessels and components. You compare your results against the functional unit you defined at the start, verifying that reported impacts match the specified processing capacity and operational lifetime. When competitors claim lower environmental impacts, you check whether they used the same functional unit and impact categories or whether they cherry-picked favorable metrics while excluding others that show worse performance.
Results that omit key impact categories or use non-standard functional units signal incomplete assessments that won't survive third-party verification during carbon credit validation.
Watch for allocation errors
Allocation mistakes occur when your BioTreater™ system produces multiple outputs like purified BioMethane and captured CO2, and you need to divide environmental impacts between these co-products. You allocate based on mass, energy content, or economic value depending on which method best represents how products share responsibility for lifecycle burdens. Using mass allocation when products have vastly different market values distorts results by assigning too much impact to low-value byproducts and too little to high-value products.
Double-counting represents another common error where you include the same impact in multiple lifecycle stages. Transportation emissions get counted when materials move from suppliers to manufacturers, but you shouldn't count them again when totaling manufacturing phase impacts unless the transportation serves a different purpose within that stage. Your documentation prevents this by tracking which processes you include at each boundary crossing.
Verify assumptions match reality
You validate critical assumptions after collecting operational data from installed systems, checking whether your projected maintenance schedules, energy consumption rates, and equipment lifetimes align with actual field performance. When assumptions prove incorrect, you update your model and recalculate results rather than defending outdated projections that no longer reflect real-world operation. Sensitivity analysis reveals which assumptions most heavily influence final results, showing where you need the most accurate data to maintain credible outcomes during carbon credit audits and regulatory reviews.
A simple way to move forward
You now understand how a cradle to grave life cycle assessment provides the complete environmental picture that carbon credit validators, regulators, and financial stakeholders demand in 2026. The framework covers every stage from raw material extraction through disposal, giving you the verifiable data your clients need to secure financing and validate emission reduction claims rather than relying on incomplete assessments that fail third-party audits.
Start by requesting complete lifecycle documentation from your equipment suppliers, specifically asking for cradle to grave assessments rather than limited gate-to-gate or operational-only data. Your clients depend on you to integrate components with proven lifecycle performance into their BioMethane systems, not equipment backed by marketing claims that can't withstand regulatory scrutiny.
At 99pt5, we provide comprehensive lifecycle data for our BioTreater™ systems because we know your projects require independently verified performance metrics that hold up during carbon credit applications and ESG disclosures. See how our guaranteed 99.5% emission reduction translates across the complete equipment lifecycle.